Tools / 03 Flow

Footprint Patterns18 order flow patterns labeled on the bar

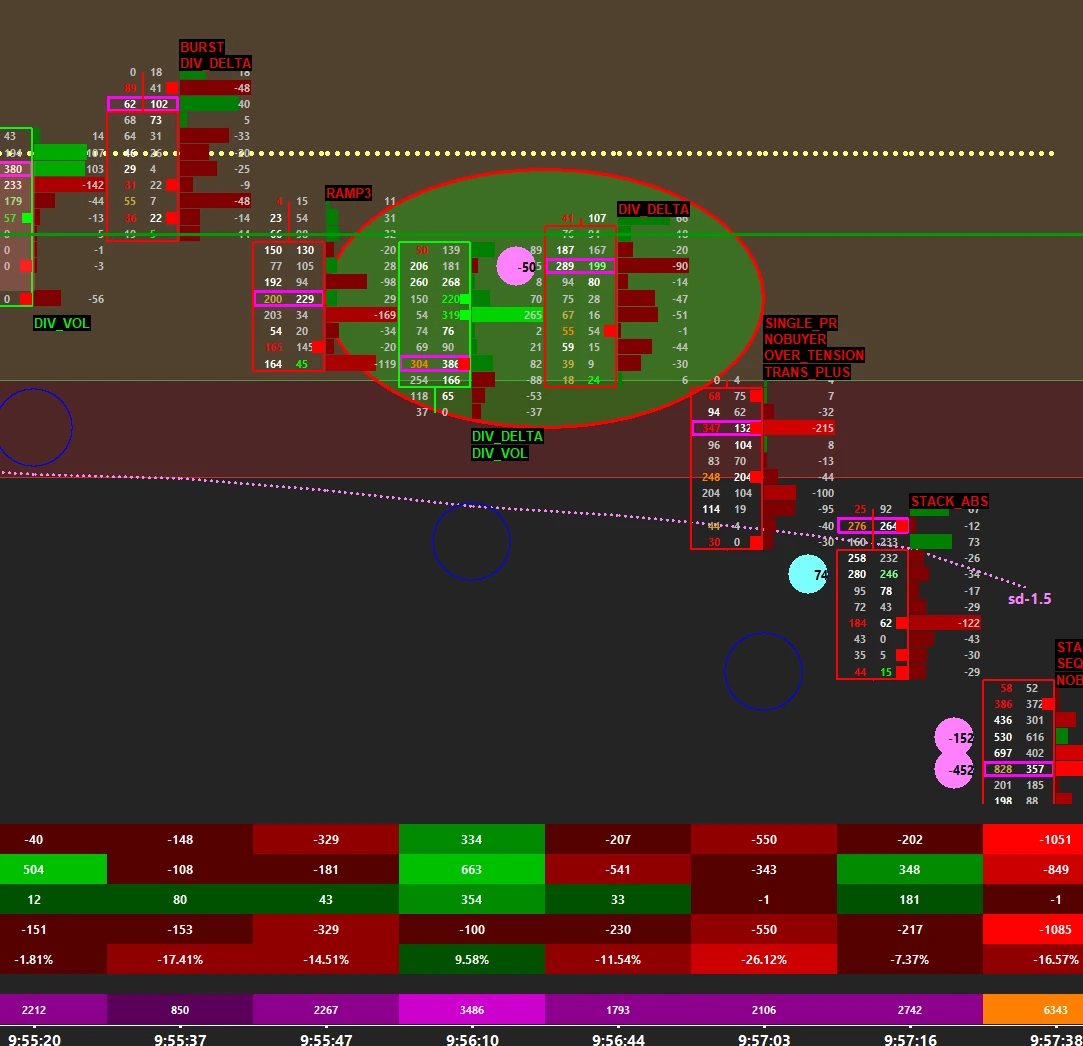
Delta, volume, bid and ask, the VWAP, your levels, all at the same time while price moves. Reading a footprint live is one of the hardest things in trading. The study reads it for you and names what happens inside each bar.

Footprint Patterns 5:38
2.50 range footprint on a live ES session · EN/FR subtitles
What you see on the chart

One bar, many patterns.

One bar

A bar running out of steam

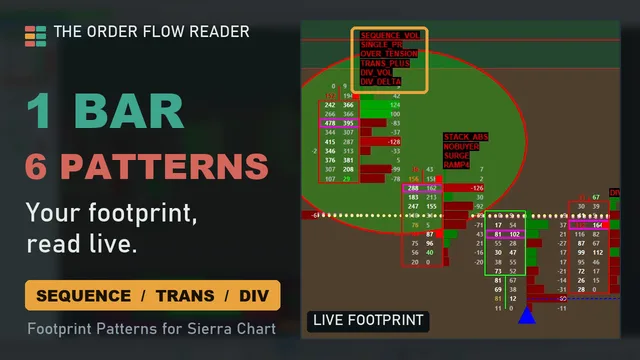
Several patterns often stack on the same bar. In the video, price comes back to retest the VWAP and that single bar carries six: SEQUENCE_VOL (bid volume growing at five levels in a row), SINGLE_PR (rejected at the extreme), OVER_TENSION, TRANS, DIV_VOL and DIV_DELTA.

Try to see all of this while you trade. The study shows it right away.

the VWAP retest bar with its six labels
Live, then locked

On the current bar, final at the close

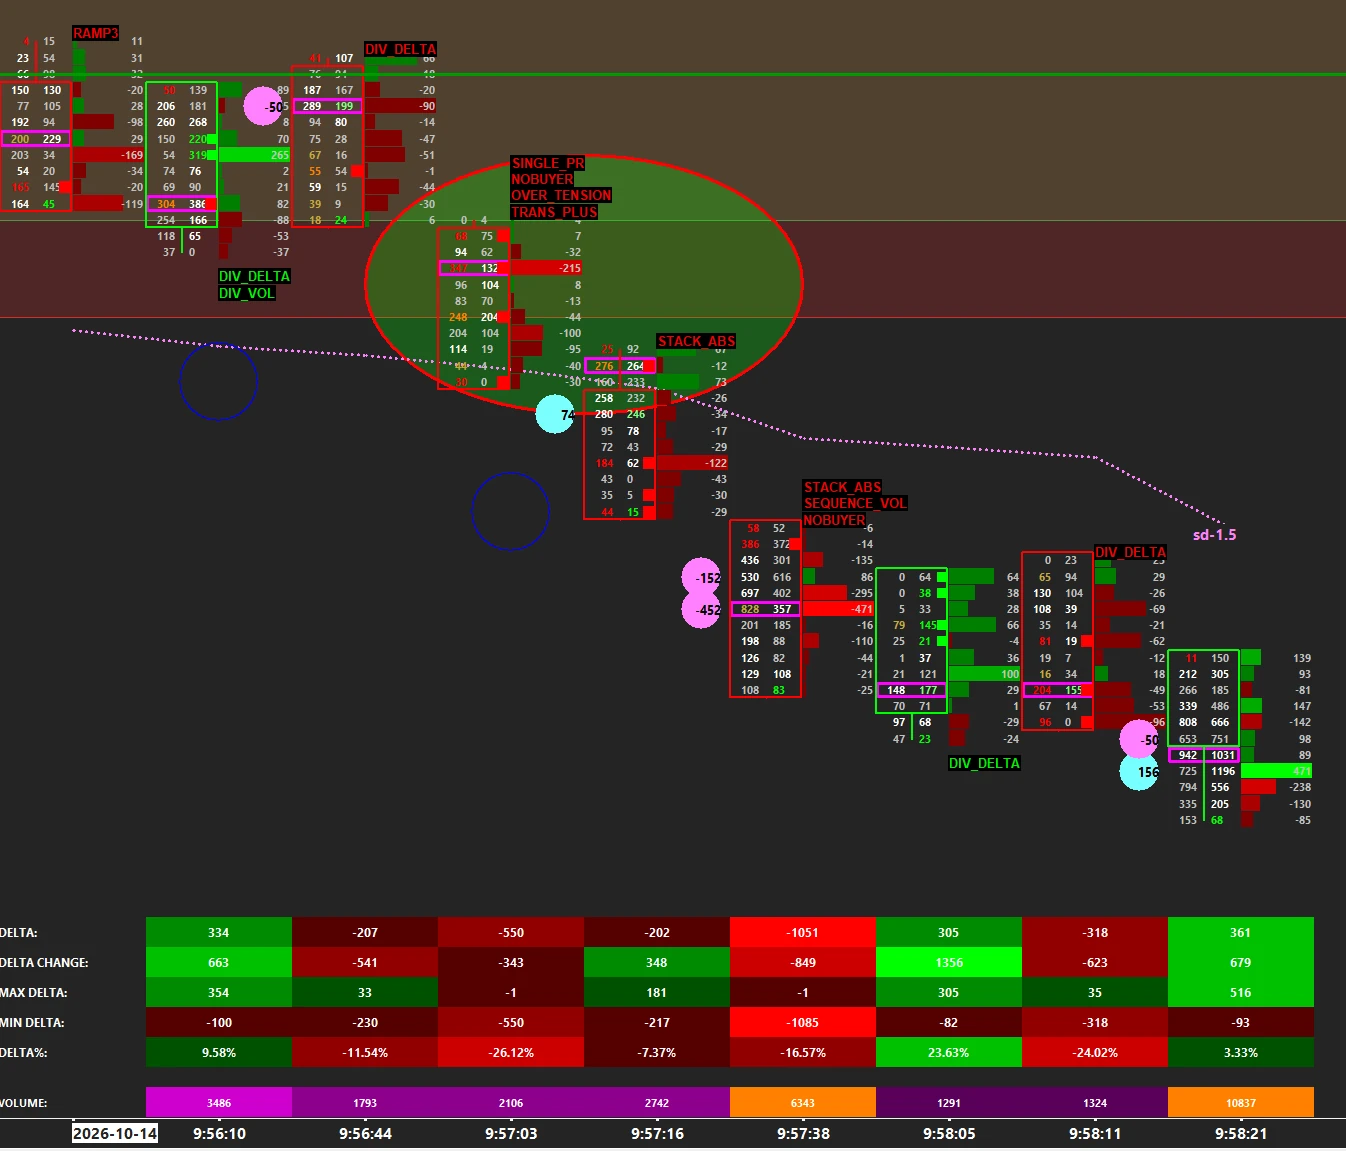
Patterns appear live on the current bar. When the bar closes they are locked: what you see after the close never changes, so a replay shows exactly what was there live.

the current bar with live labels
Inside your plan

Evidence where it matters

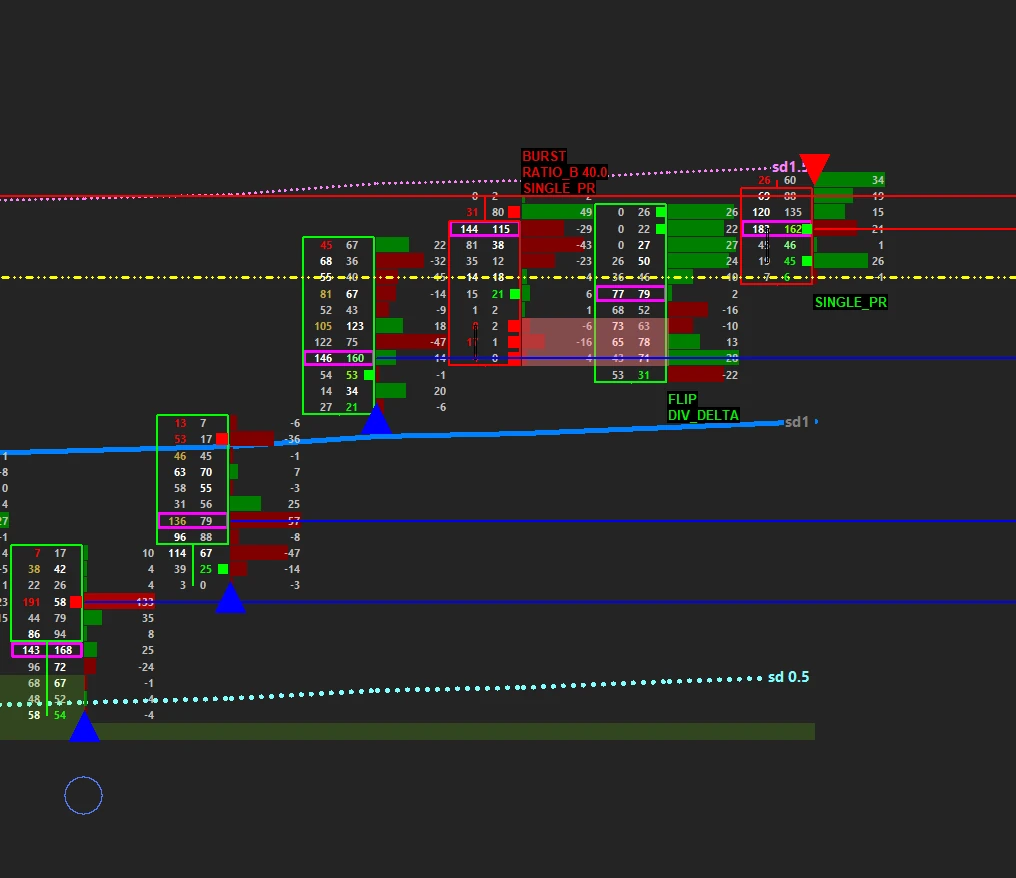
Your plan is to sell a pullback on the composite. Price breaks out, comes back to test it. You arrive on your level and look at the footprint: a divergence, a TRANS, a RAMP4 with negative delta, a TRANS_PLUS. On the bars that matter, at the levels that matter, the study stacks up the evidence.

pullback on a composite edge with stacked labels
Leaving value

Trapped traders

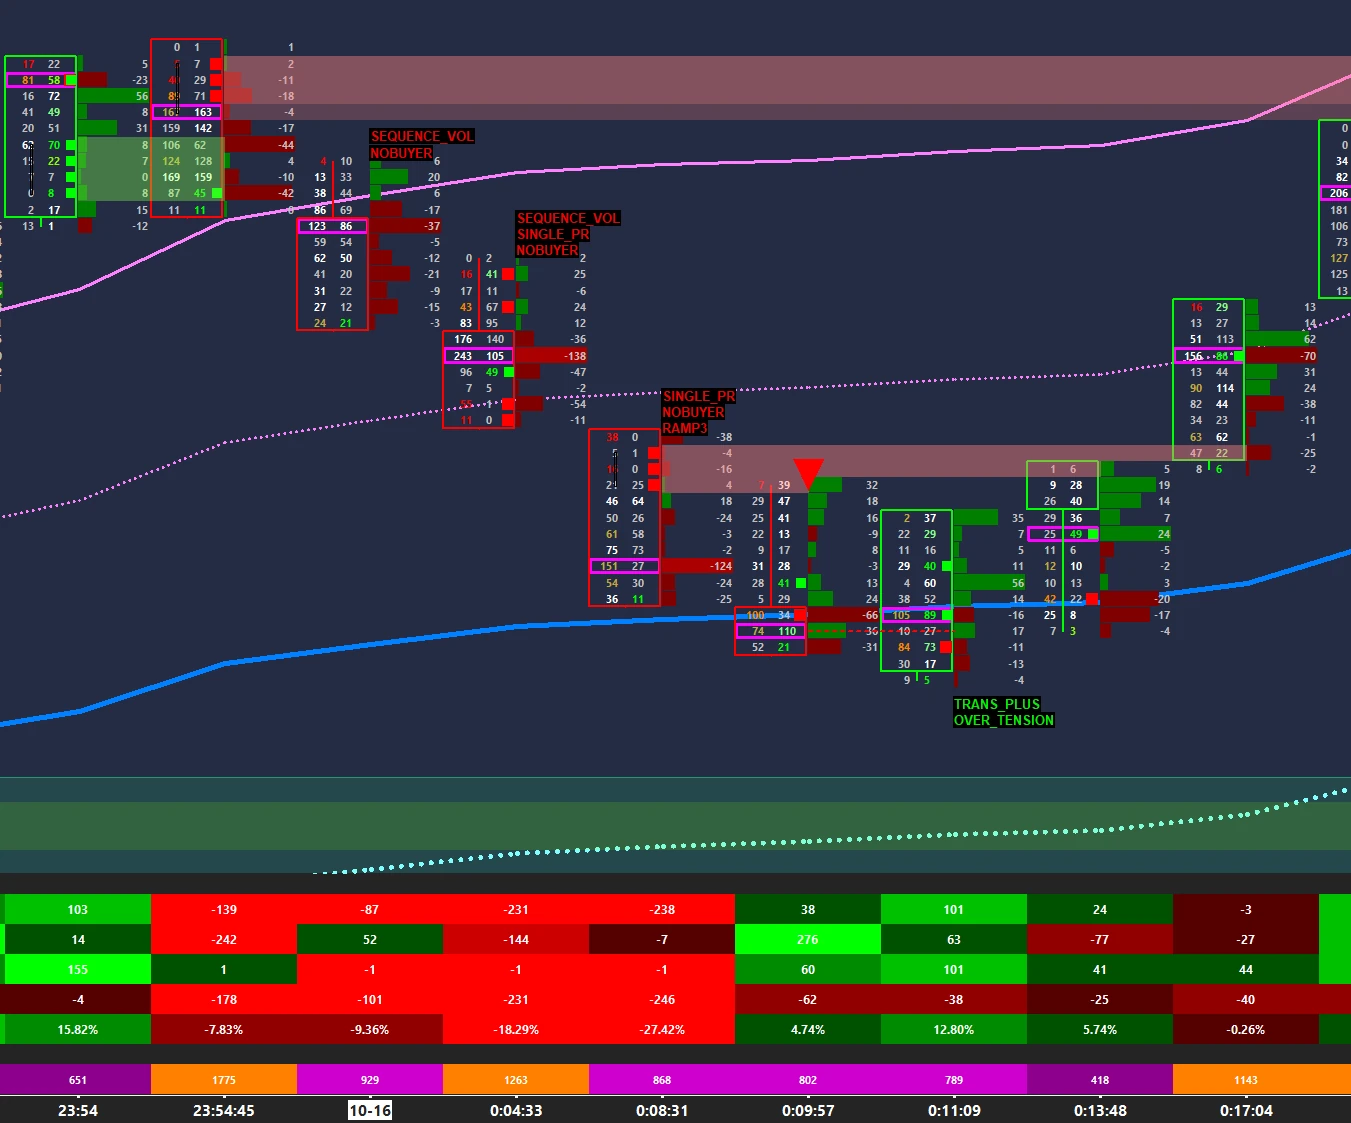
When price leaves the composite: SINGLE_PR, NOBUYER, OVER_TENSION, TRANS_PLUS. Traders bought, price barely moved up, and they probably had to sell right there.

bar leaving the composite with NOBUYER and OVER_TENSION
The patterns

18 patterns, the rule behind each one.

Bullish labels sit below the bar, bearish labels above. The full rule and its thresholds are in the study description in Sierra Chart.

LabelWhat it means
Delta
FLIPThe previous bar's delta was on one side, this bar's delta is clearly on the other.
DIV_DELTANew low (high), but the delta does not follow and the bar closes near its opposite end.
TRANSThe delta improves over 3 bars and turns to the label side on this bar.
TRANS_PLUSThe delta turned on the previous bar and keeps accelerating.
OVER_TENSION3 bars of rising (falling) delta, the last one much stronger than the one before.
RAMP3 / RAMP43 or 4 bars in a row with the delta getting stronger in the same direction.
SURGEAfter an opposite-delta bar, the delta suddenly grows for 3 bars.
SLOWDOWN3 bars of shrinking delta on the same side: the aggressive side is fading.
Volume at the extremes
SINGLE_PRAlmost nothing traded at the extreme, much more on the next level: price was rejected right away.
SEQUENCE_VOLFrom the low (high), aggressive volume grows at every price level, five levels in a row or more.
RATIO_BVolume on the 2nd level vs the extreme. A ratio of 30 means the interest simply stopped at the last price.
BURSTSudden aggressive volume on the level next to the extreme compared with the rest of the bar.
TAILA short block of opposite delta at the extreme: traders trapped at the low (high).
STACK_ABSHeavy selling (buying) on the 3 levels next to the low (high), but the extreme holds: passive orders absorb.
CLUSTER_FAILA cluster of aggressive selling (buying) at the low (high) that fails to extend the move.
NOBUYER / NOSELLERThe aggressive side is exhausted at the extreme: nobody wants to buy up here (sell down here).
DIV_VOLNew low (high) on strong volume, with little extension and a close near the opposite end.
What it does not do

A reading aid, not a trade.

Patterns on both sides

A divergence doesn't mean you have to sell, and a Ratio B of 114 doesn't mean you have to buy.

What happens, not what to do

The study tells you what is happening inside the bar. The decision is yours.

Levels first

A label in the middle of nowhere is noise. On your level, it is evidence.

Settings

More than 100 inputs, so you can set it up exactly the way you read the footprint.

  • Each pattern can be shown or hidden.
  • Minimum volumes and thresholds per pattern, tuned on ES by default.
  • Footprint display: bid × ask or volume, delta table below the bars.

Watch it on your own ES chart for 7 days.

Start your free trial