Tools / 04 Execution

Absorption Pro

Find the price where aggression stopped working. Absorption Pro marks the levels where aggressive orders hit a passive wall on your Sierra Chart footprint and price failed to move through.

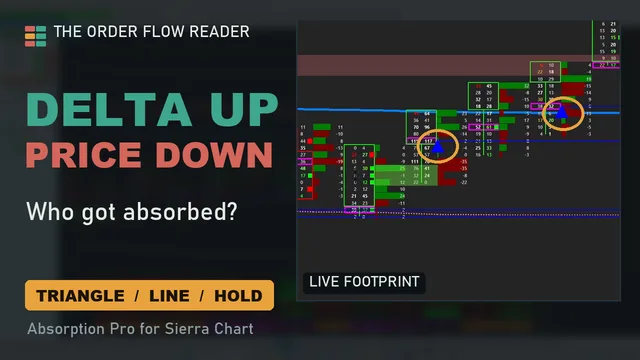
Thumbnail: Delta up, price down. Absorption triangles circled on a live ES footprint 2:52
Live ES footprint · triangles, absorption lines, holding vs broken · EN/FR subtitles
What you see on the chart

Three scales of absorption.

The same idea measured over three horizons: heavy volume on one side, little or no progress in price.

Micro · one bar

A single bar takes the hit

One bar trades far more volume on one side than the other, yet closes without extending in that direction.

You see
A micro marker at the absorbed price.
It means
Aggressive sellers (or buyers) met a passive limit order that did not give way, on this bar.
Block · recent bars

The same zone keeps absorbing

Several absorption hits cluster inside a few ticks over the last bars. One hit can be noise; repeated hits in the same zone are a level someone is defending.

You see
A block zone drawn over the cluster.
It means
A passive participant is reloading at that zone.
Macro · session structure

A level that holds over time

Absorption keeps showing up at the same level over a longer window while price makes no progress beyond it.

You see
A macro marker and level.
It means
A structural level for the session. Read it together with VWAP, composite value and the narrative zones.
What it does not do

A marker, not a trade.

No entry signal

An absorption shows a level being defended. Whether you trade it depends on context and on what happens next.

No stop or target

The study does not manage orders. Your risk plan stays yours.

Context decides

Absorption against the trend at a key level is not the same event as absorption in the middle of nowhere. That is what steps 01 to 03 are for.

Main settings

Defaults tuned on ES.

These are the values I trade with. You can adjust them in Study Settings; the install video explains each one.

SettingDefaultWhat it controls
Detection
Abs Min Bar Volume400Minimum bar volume before a bar can count as absorption.
Abs Factor1.5How much heavier the absorbed side must be.
Abs Factor Bid Ask1.05Bid/ask ratio threshold at the absorbed price.
Block
Block Bars Lookback15How many recent bars are scanned for clustered hits.
Block Min Hits3Hits needed to form a block.
Block Ticks4Maximum height of the block zone, in ticks.
Macro
Macro Bars Lookback30Window used to find a structural level.
Macro Min Hits3Hits needed at the same level.
Macro Tolerance Ticks4How close hits must be to count as the same level.
Macro Progression Ticks4Maximum price progress allowed beyond the level.

Watch it on your own ES chart for 7 days.

Start your free trial