Tools / 03 Flow

Cumulative DeltaEffort vs result: absorption, pressure, missing participation

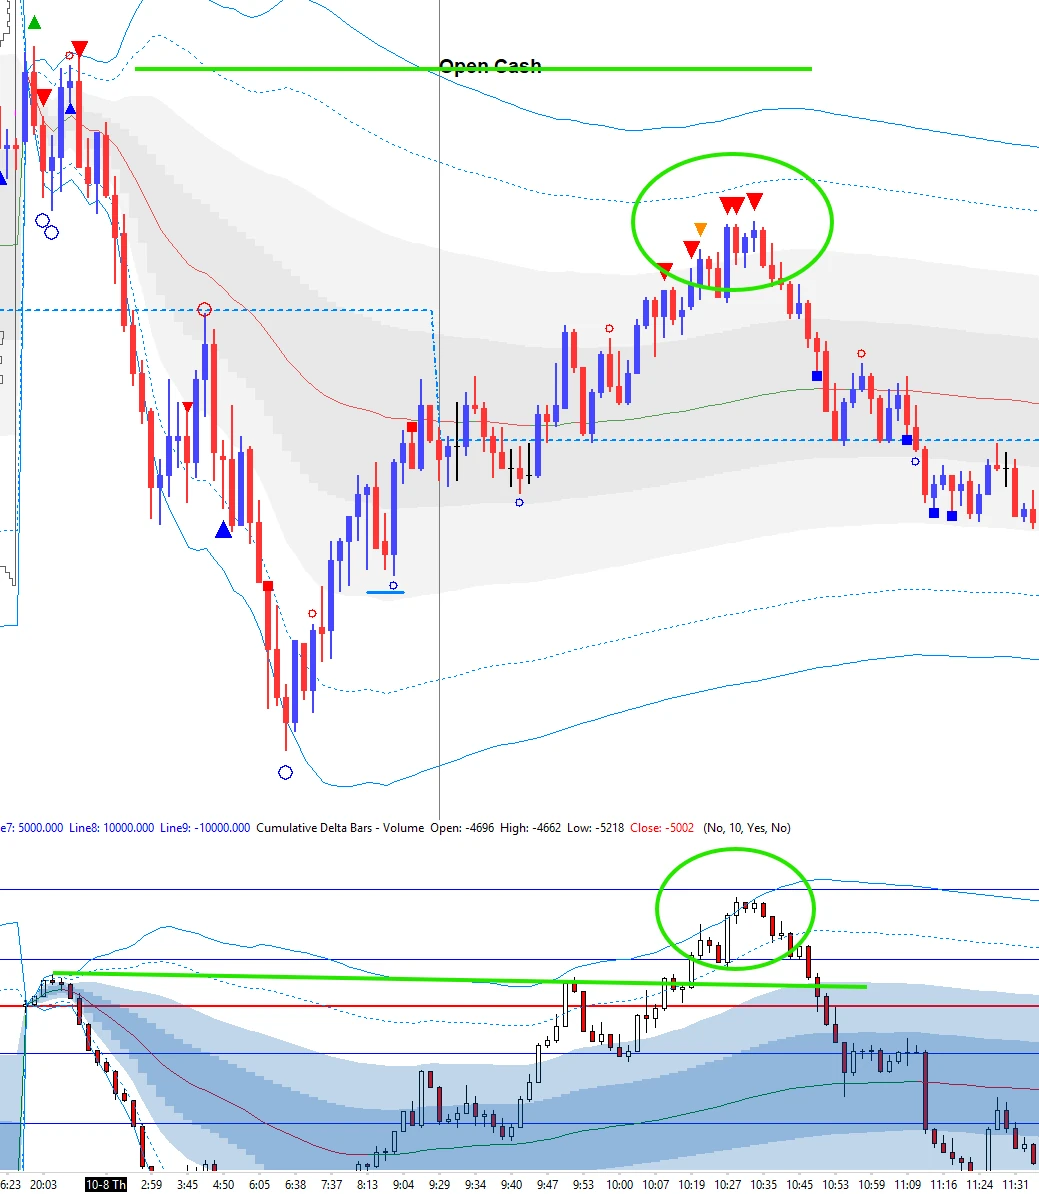
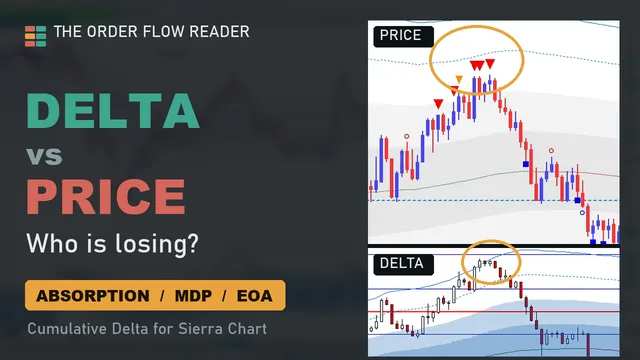
The cumulative delta makes a new high, but price doesn't: buyers are being absorbed. Reading delta and price together while you trade is hard. The study reads both for you and marks the moments that matter.

Cumulative Delta 4:22
5000-volume ES chart with the cumulative delta below · EN/FR subtitles
What you see on the chart

Who is winning, who is losing.

The cumulative delta is aggressive buyers minus aggressive sellers, reset at the cash open and for globex, with its own VWAP and bands. On its own it says who is aggressive. What matters is how price reacts to it.

Absorption · red triangle

The delta pushes, price doesn't follow

The cumulative delta makes a higher high, but price stays below its previous high. Buyers are in control and still can't move price: limit sellers are absorbing them.
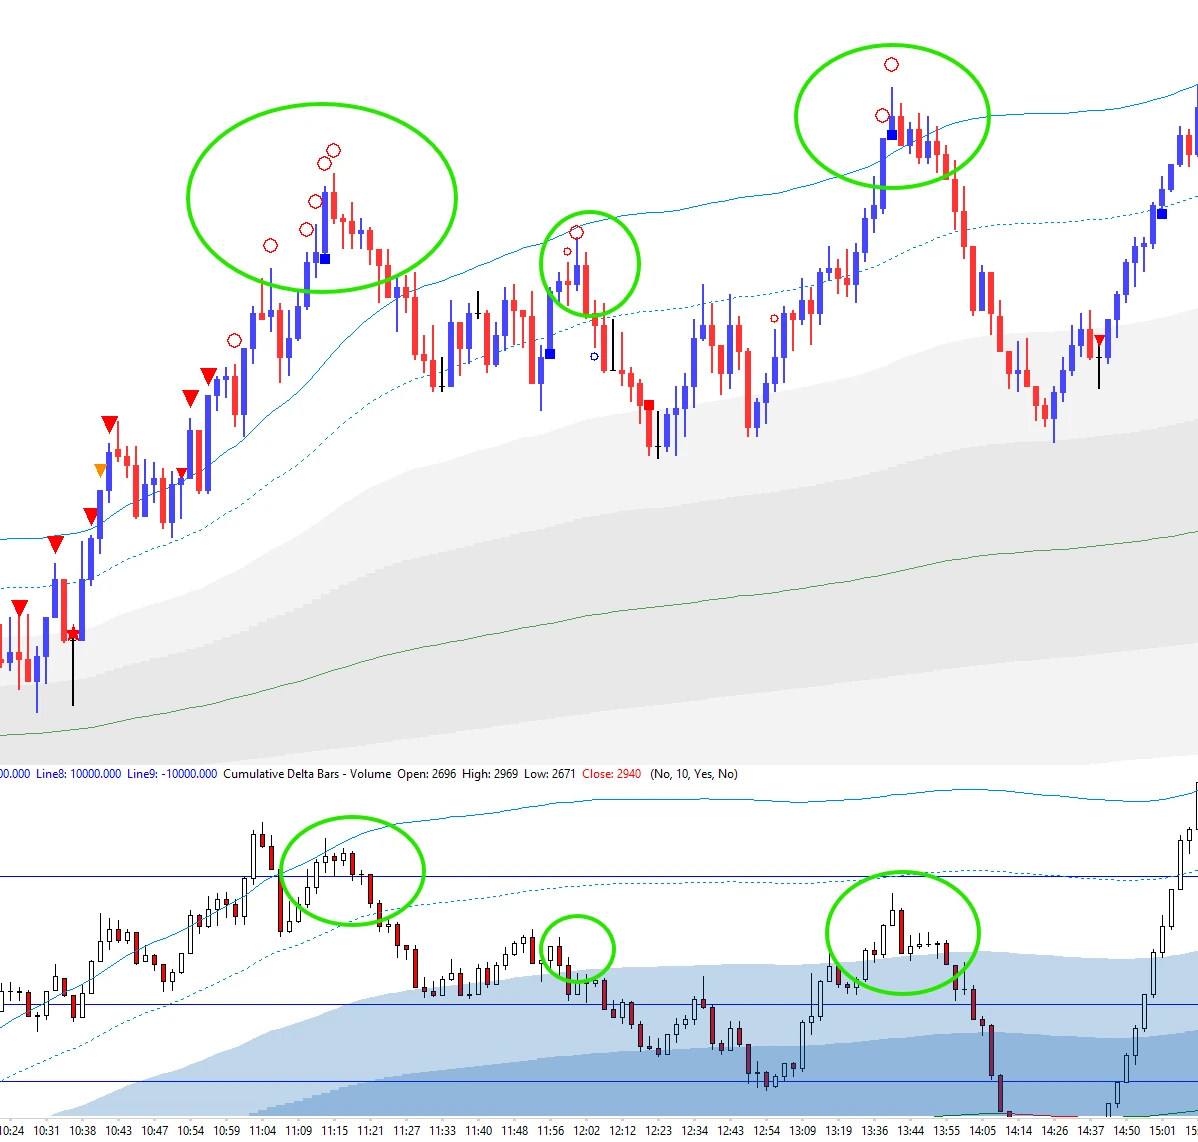
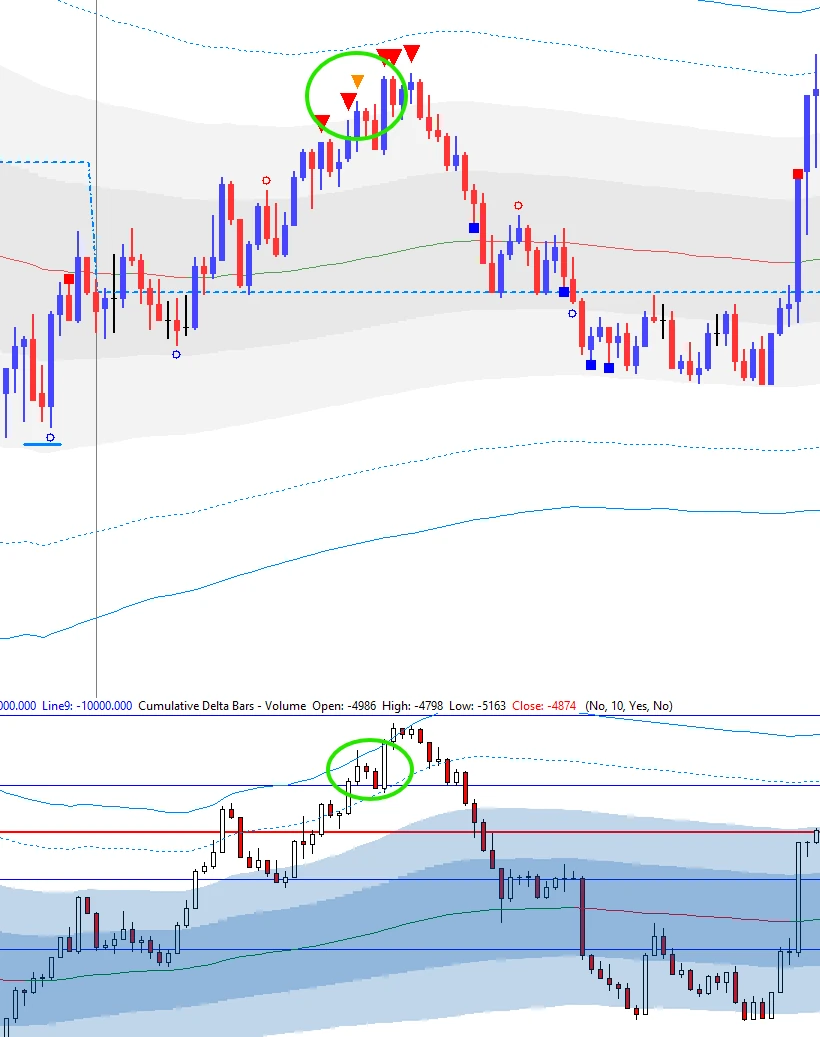
red triangle: delta higher high, price lower high
Pressure · orange triangle

They keep pushing into the level

After an absorption, buyers have two options. Keep pushing: they buy more and price goes up a little. When they understand they can't break through, they reverse their position and price goes the other way.

orange triangle after a red one, then the reversal
Missing participation

A new high nobody paid for

Price makes a higher high, but the cumulative delta doesn't. Same on the other side: a lower low without the delta. In one example, the delta stays almost flat while price climbs 15 points. On the S&P 500, that's a lot.

The study shows you the weak moves.

price higher high with a flat delta
Walls · squares

A defended price

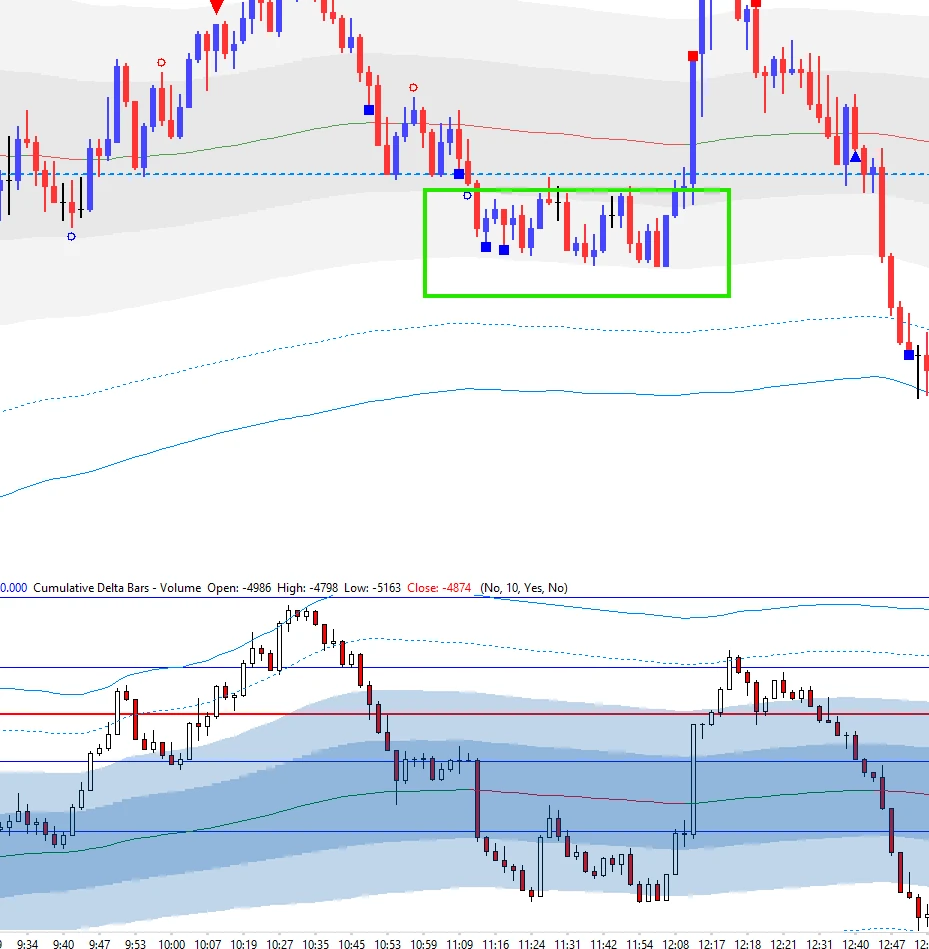
A wall is a price where a lot of limit orders were waiting, buy or sell. In the video, one sits right on SD-1: someone with size didn't want price to reach it, and kept the market balanced.

a wall square on SD-1
Micro scale

The same reading on the last bars

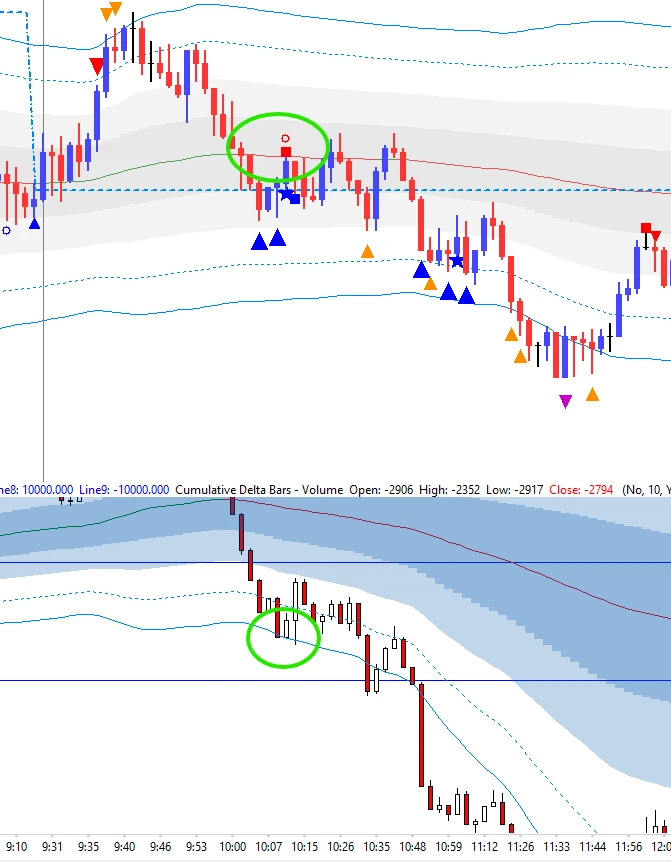
Small marks compare a bar with the last two or three bars only: micro absorption, micro missing participation. They show local weakness, not a trade.

micro marks on a few bars
What it does not do

A reading aid, not a trade.

No buy or sell call

A mark shows who is losing. What you do with it depends on your level and your plan.

Micro is local

Micro patterns describe two or three bars. Read them inside the bigger picture.

Walls need depth data

Walls come from the order book, so they need a feed with market depth.

Settings

More than 40 inputs, so you can set it up exactly the way you read the market.

  • Patterns: absorption, pressure, missing participation, walls, each on the macro and micro scale.
  • Display: colors, levels, thresholds, VWAP and bands of the delta.
  • Cumulative Delta Importer (included): the same marks on your footprint.

Watch it on your own ES chart for 7 days.

Start your free trial