Order flow & market profile tools for Sierra Chart

Read the market before you trade it.

Six Sierra Chart studies that turn market context, VWAP, TPO, cumulative delta, footprint and absorption into one clear market read.

Built for discretionary ES traders. No signals, no black box. The decisions stay yours.

7 days free · access runs on your Sierra Chart username · ready-to-open ES Workspace

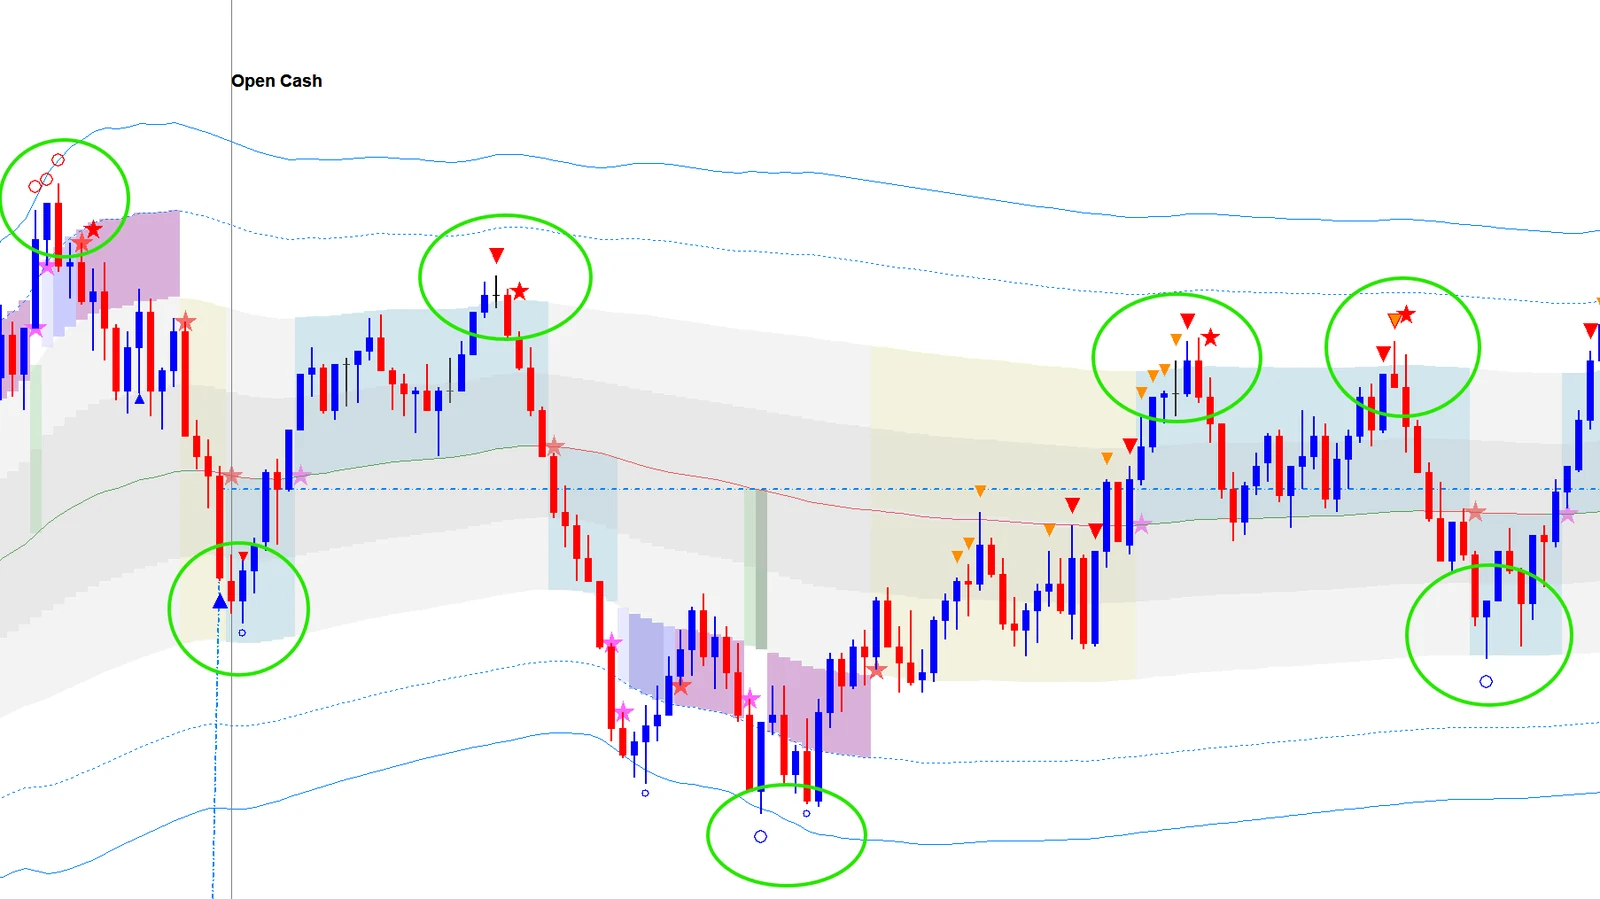
ES cash session on a 5000-volume chart with the daily VWAP and SD bands, regime colors from Market Context and cumulative delta markers; green circles highlight the markers printed at the session's turning points
Real ES session · daily VWAP, regimes and delta markers · circles added to highlight the turns

Tools for discretionary traders

Studies that make the auction readable on your own Sierra Chart: footprint, delta, value and context on the same screen.

Signal service or course

No buy/sell calls, no copy trading, no coaching program. You read the market, the tools show you what to read.

Built by an ES trader, used daily

Every study runs on my own charts each morning. Updates and new studies ship to subscribers as they are made.

The suite · 6 studies

One reading of the market, from context to the trade location.

Each study works on its own. Together they follow the order you read a session in, from the big picture down to the price where someone defends a level.

Every screenshot below comes from ES sessions of October 2026, picked by date, not by result: the footprint shows a choppy day.

  1. ContextWhere is the market relative to value?Market Context · Composites & Key Levels
  2. LocationWhere should I pay attention?Session Narrative
  3. FlowWho is actually aggressive?Cumulative Delta · Footprint Patterns
  4. ExecutionWhere is aggression being absorbed?Absorption Pro
01 Context · VWAP & regime

Market ContextRegime, target and risk on every horizon, daily to yearly

Where price sits relative to value, today and over the week, month, quarter and year.

  • Daily VWAP and SD bands, cash and globex
  • Weekly to yearly anchored VWAPs
  • Market regime: balanced, imbalanced, failed
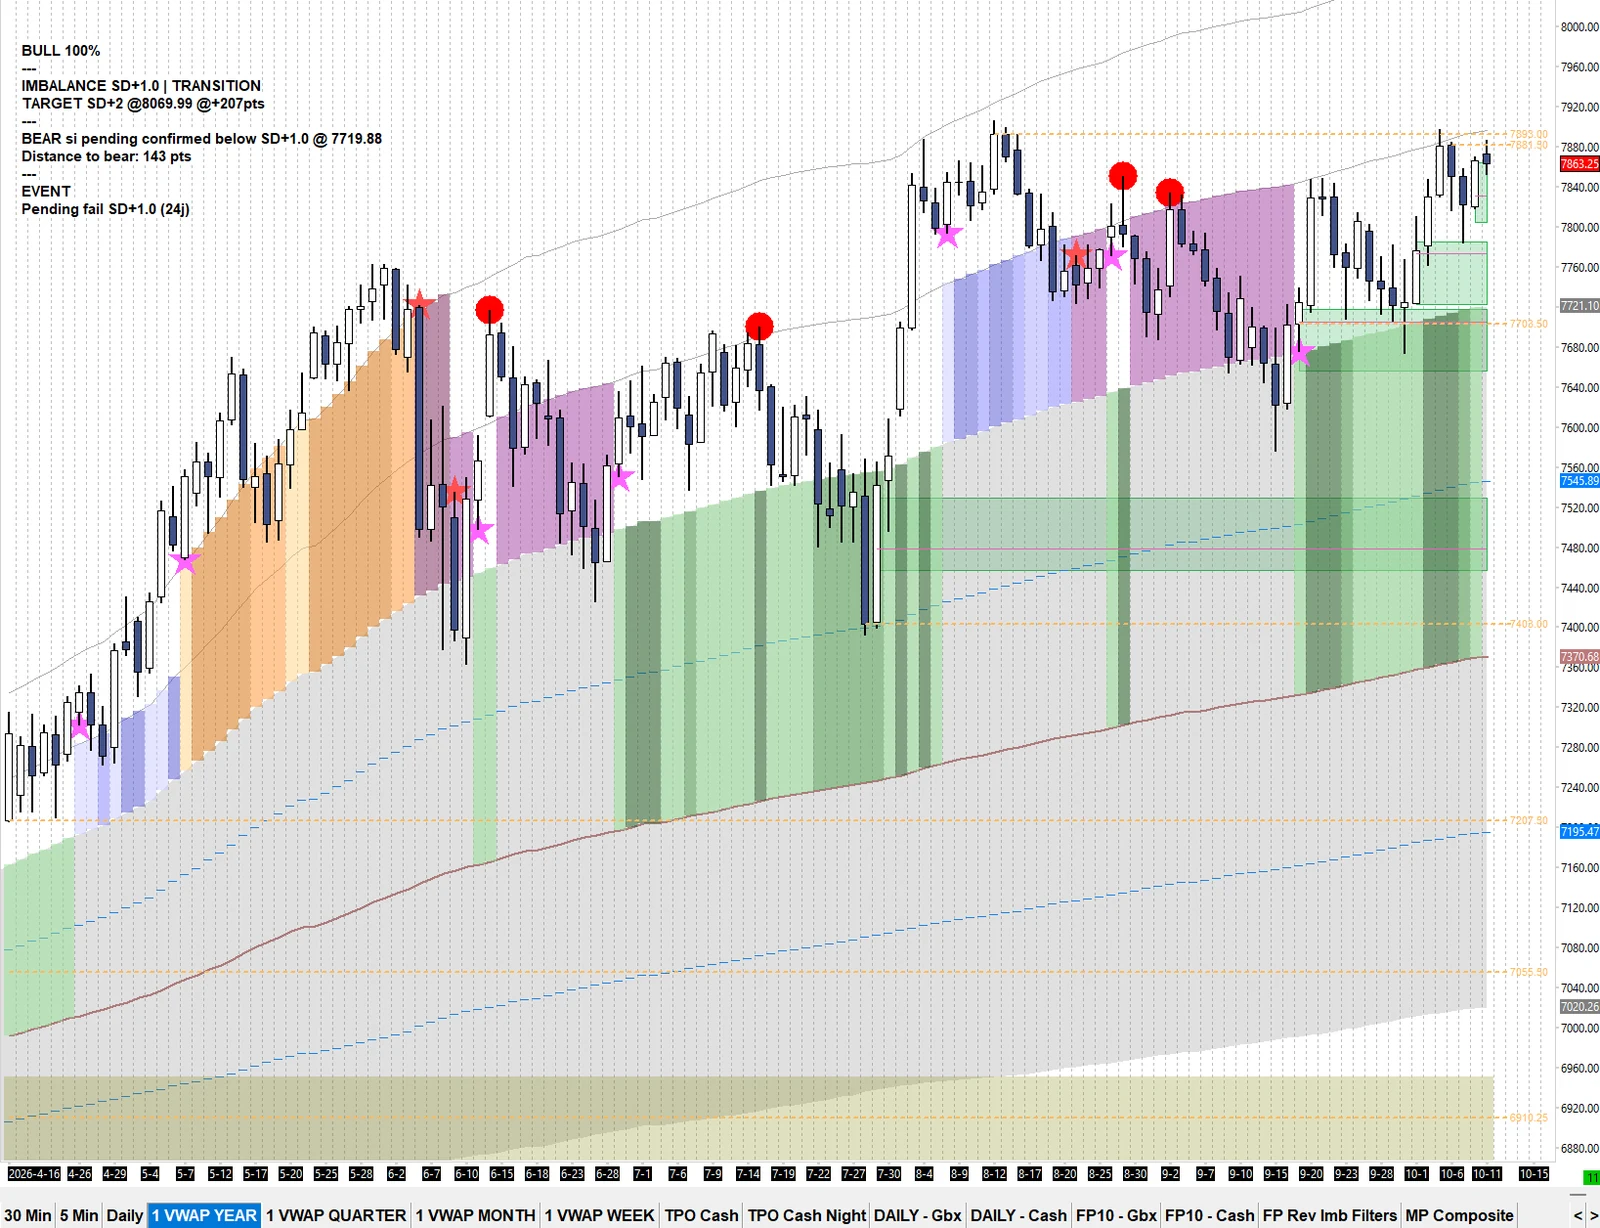
ES yearly VWAP on daily bars with SD bands, colored regime bands and the Market Context panel reading BULL, imbalance above SD+1

Yearly VWAP on daily bars: the panel reads the regime (imbalance above SD+1), the next target (SD+2) and the level that would turn it bearish.

Watch the video · 3 min
01 Context · TPO

Composites & Key LevelsMulti-session value and the levels that matter at the open

Multi-session composite profiles and the levels that matter for the open, drawn automatically.

  • Composite value area, POC, duration in cash sessions
  • Prior day and overnight value areas
  • Correct composites in replay, not only live
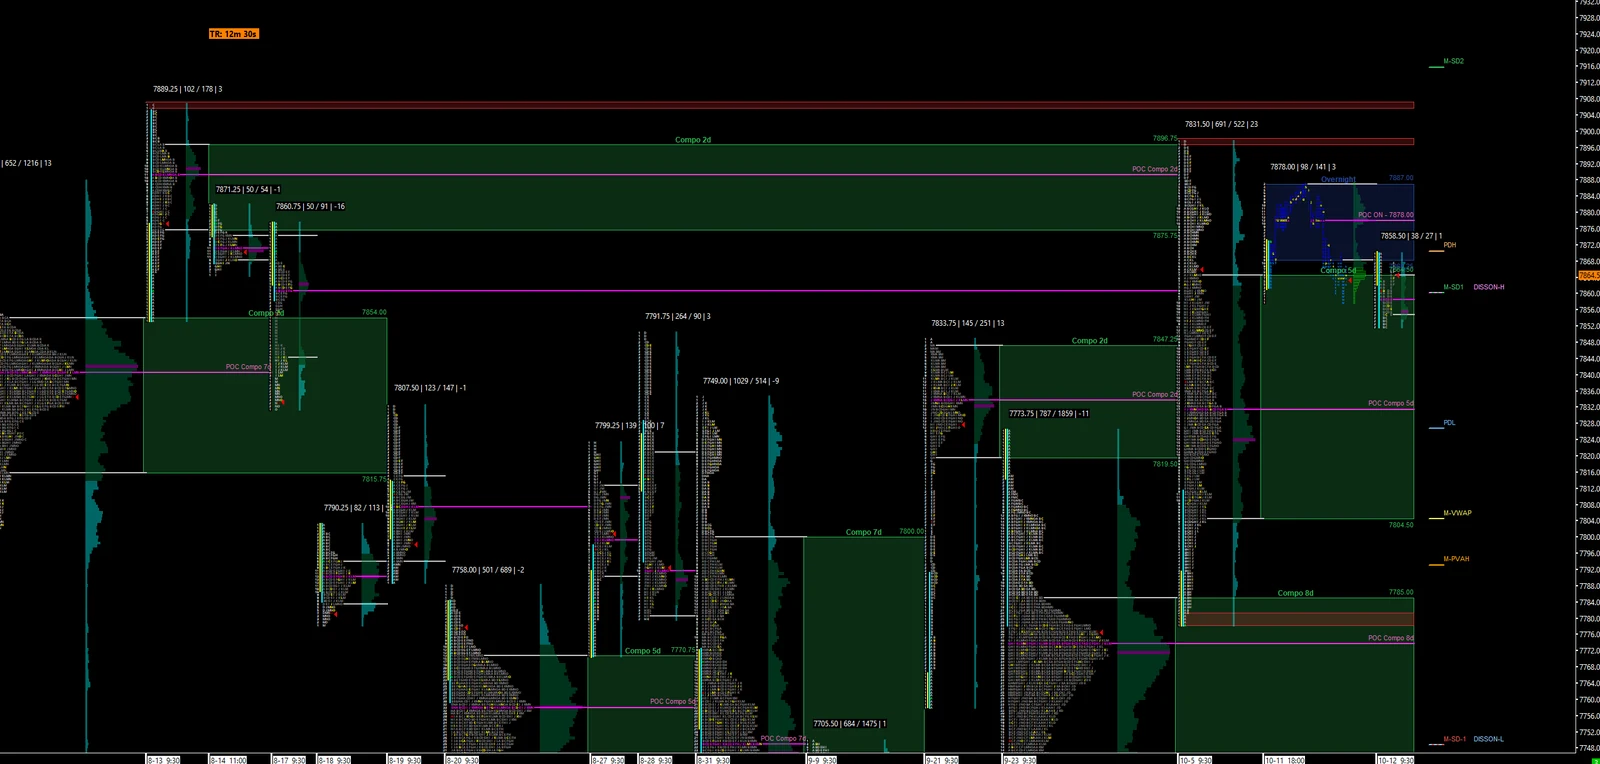
ES cash TPO chart with 2, 5, 7 and 8 session composite value areas, their POCs, the overnight value area and monthly levels

Cash TPO: 2- to 8-session composites with their POC, the overnight value area, and monthly VWAP levels on the right.

Watch the video · 4 min
02 Location · narrative

Session NarrativeThe open, read for you in plain English

A panel on your chart: where it opened, what the context expects, which levels to watch.

  • Open type and A/B period reading
  • Two plans: the level if the open holds, the level if it fails
  • Updates as the session develops
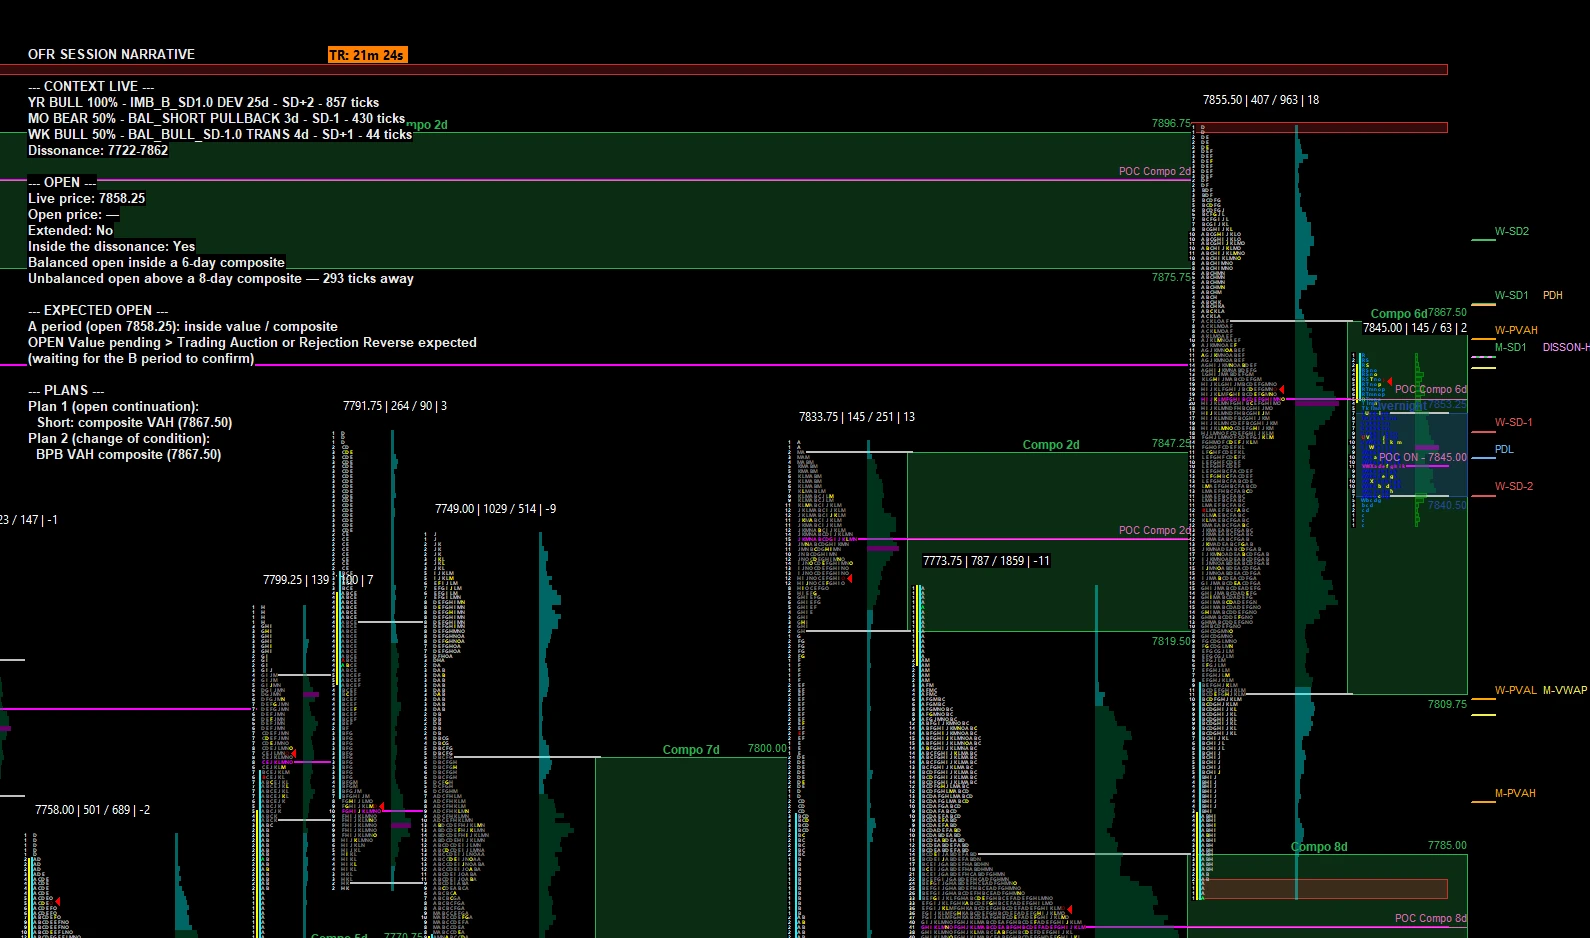
Session Narrative panel over the cash TPO chart before the US open: yearly, monthly and weekly context, price against the 6- and 8-day composites, the expected open type and the plans at the composite VAH, with composites and weekly levels drawn on the chart

Session prep before the open: context on three horizons, where price sits against value and the composites, and the open type to expect.

Watch the video · from 2:32
03 Flow · cumulative delta

Cumulative DeltaEffort vs result: absorption, exhaustion, pressure

Cumulative delta reset at the cash open and for globex, with the events that show effort without result.

  • Micro and macro absorption markers
  • Exhaustion and pressure markers
  • Bid and ask walls
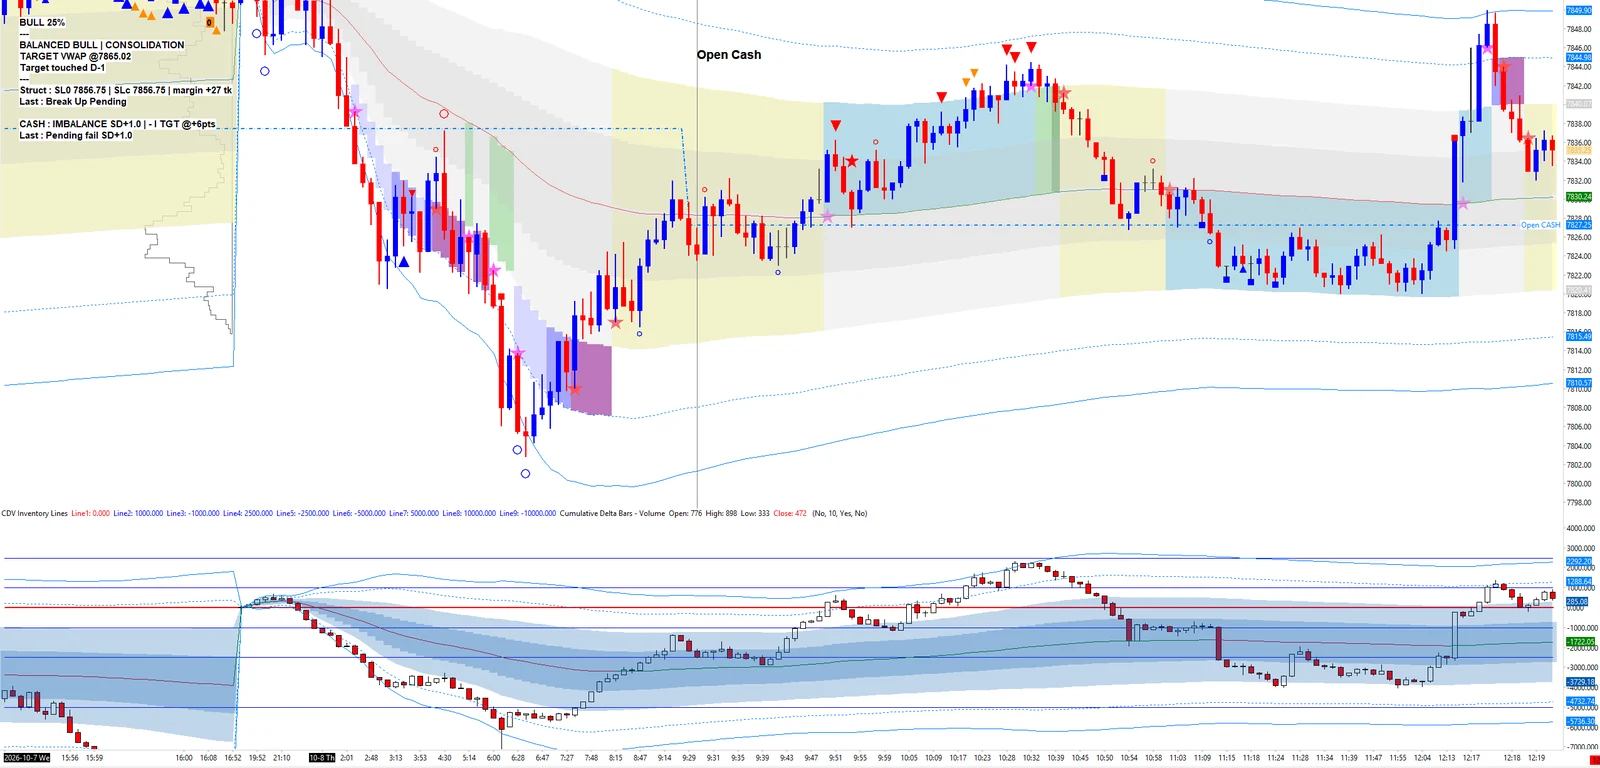
ES 5000-volume chart with daily VWAP bands and markers, and the cumulative delta below with its own VWAP and bands

5000-volume chart: the cumulative delta below has its own VWAP and bands, with markers on the price chart where effort met no result.

Watch the video · 4 min
03 Flow · footprint

Footprint Patterns18 order flow patterns labeled on the bar

A clean bid × ask footprint that names what happens inside each bar, so you read it at a glance.

  • Absorption, exhaustion, divergence, delta flips
  • Each pattern can be switched on or off and tuned
  • Built on Sierra's volume-at-price data
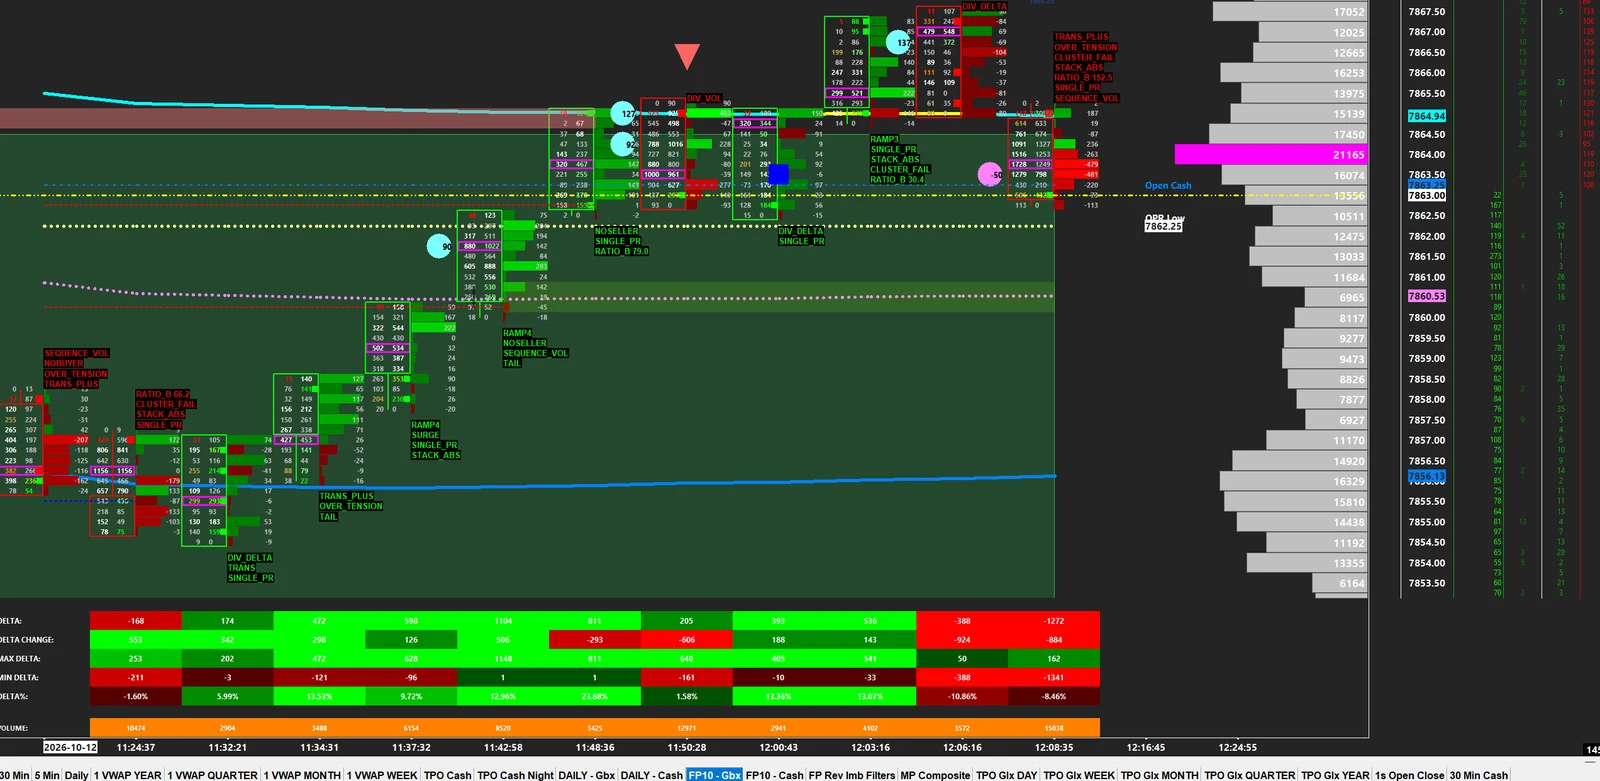
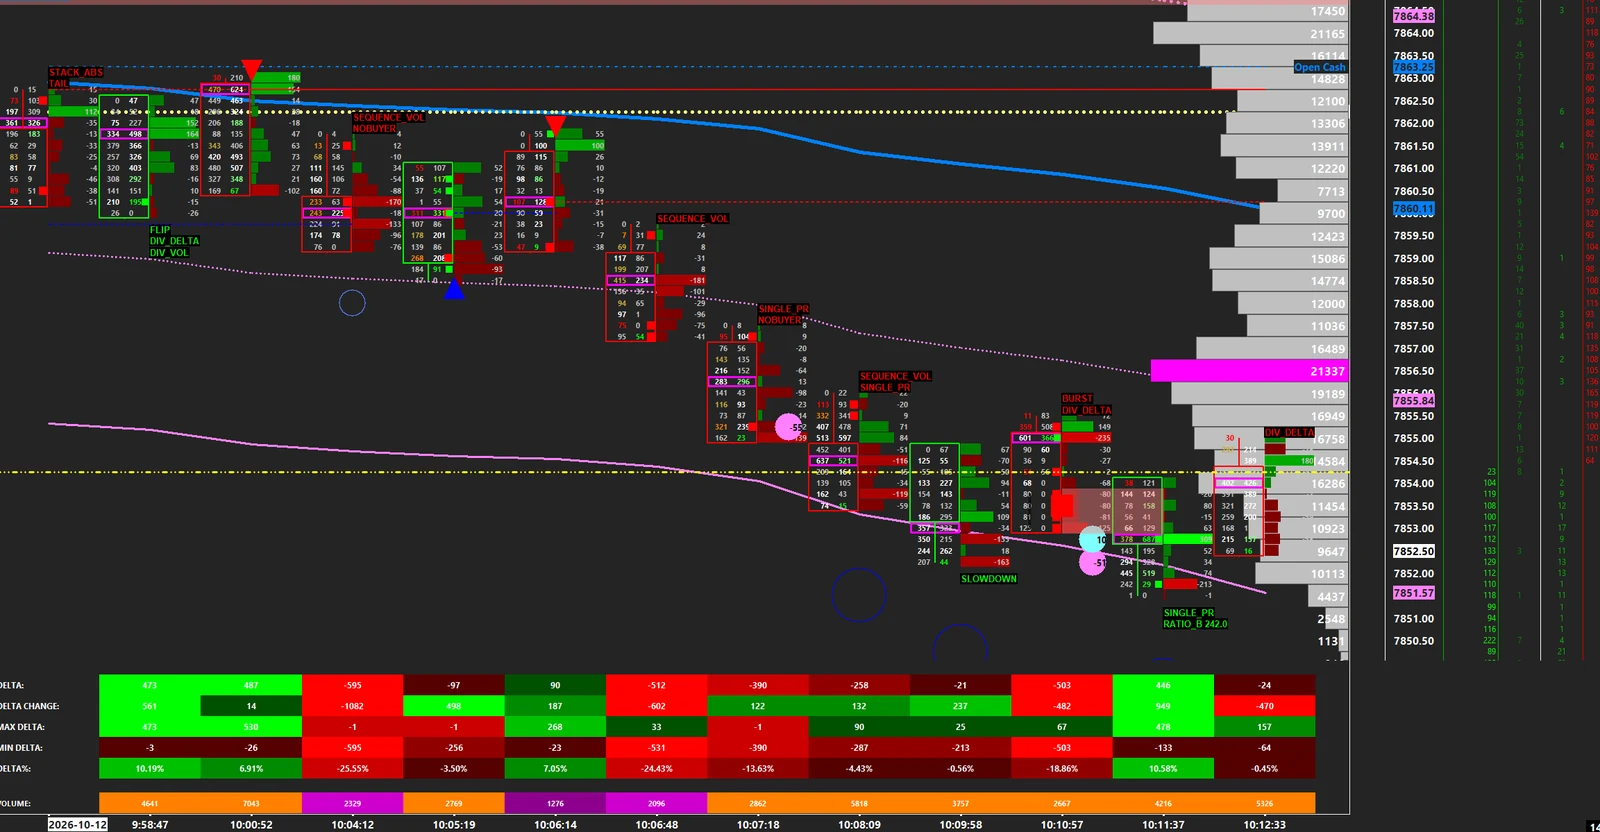
ES 2.50 range footprint with bid by ask numbers, pattern labels next to the bars, a delta table below and the volume profile on the right

2.50 range footprint at the cash open: bid × ask per price, labeled sequences, and the delta of each bar in the table below.

Watch the video · 6 min
04 Execution · footprint

Absorption Pro →Where aggression hits a passive wall

Marks the prices where aggressive orders hit a passive wall and price stopped moving.

  • Absorption at price, buy and sell side
  • Works on range and volume footprints
  • Pairs with CDV markers for confirmation
ES 2.50 range footprint after the cash open with two red absorption triangles at the top, followed by a move down

After the open: buyers lift the offer twice, price does not go higher, Absorption Pro prints two red triangles and the market rotates down.

Watch the video · 3 min
ES Workspace · included with annual

Open the ES Workspace and start reading.

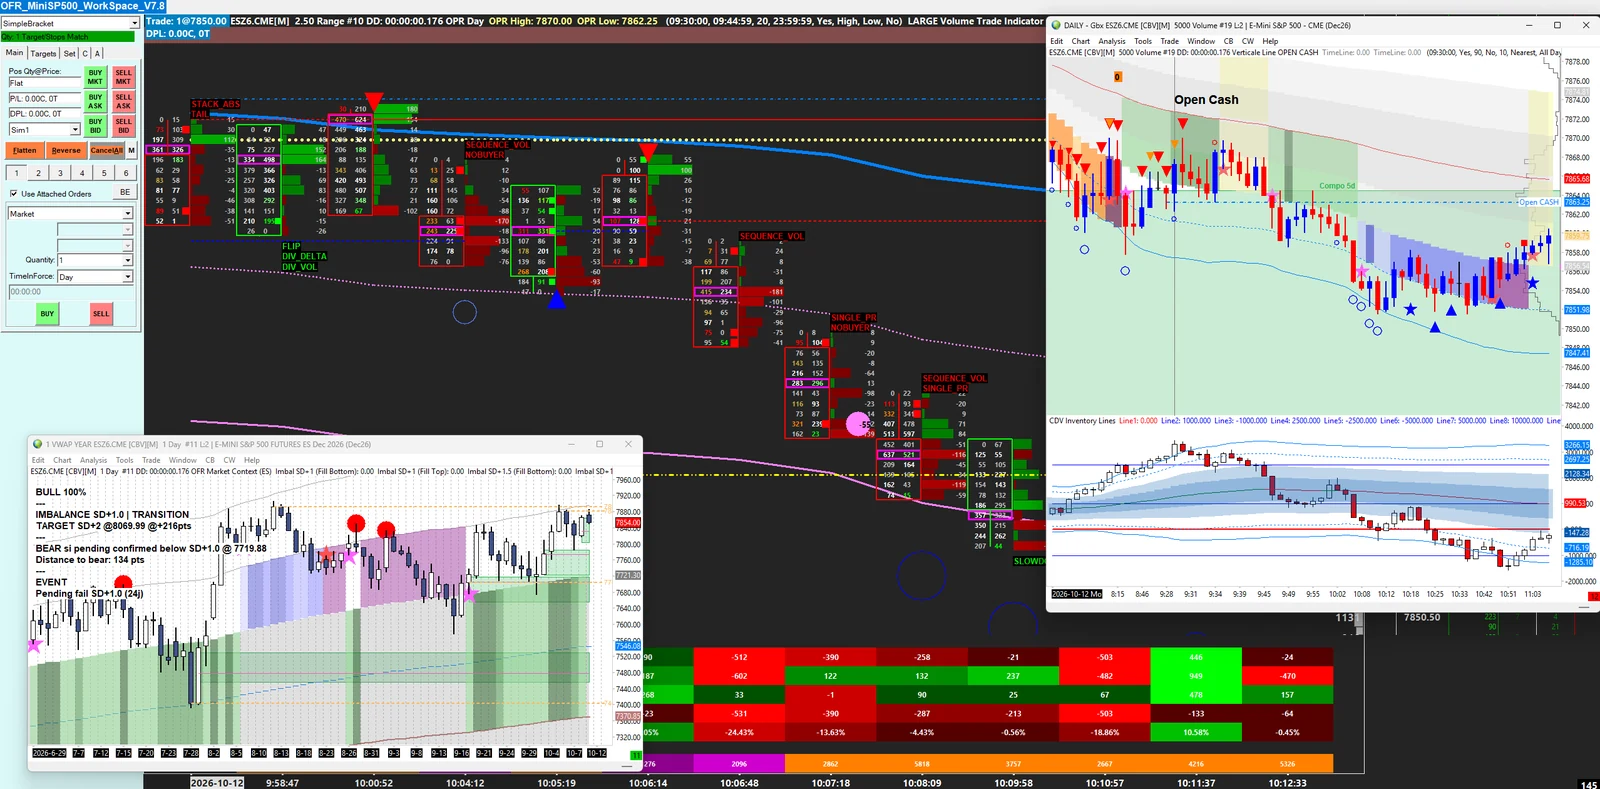
The complete chartbook I trade from, 21 charts already linked and configured: context, composites, cumulative delta, footprint. No setup, no study settings to learn. Running in minutes.

  • Cash and globex footprints, range and volume
  • TPO charts: daily, composite, monthly, quarterly, yearly
  • Daily and long-term VWAP charts

Requires Sierra Chart with a CME data feed. Switch the contract month at each quarterly roll.

ES Workspace chartbook: the 2.50 range footprint with its delta table, the yearly VWAP context window and the daily 5000-volume chart with cumulative delta

Free toolBack up every study setting of your chartbook to one CSV file with the Study Inputs Exporter. Free, no licence, works with any study. Watch the 2 min video.

Videos · real ES sessions

See the suite before you try it.

Every video is recorded on live ES charts, with chapters and English and French subtitles.

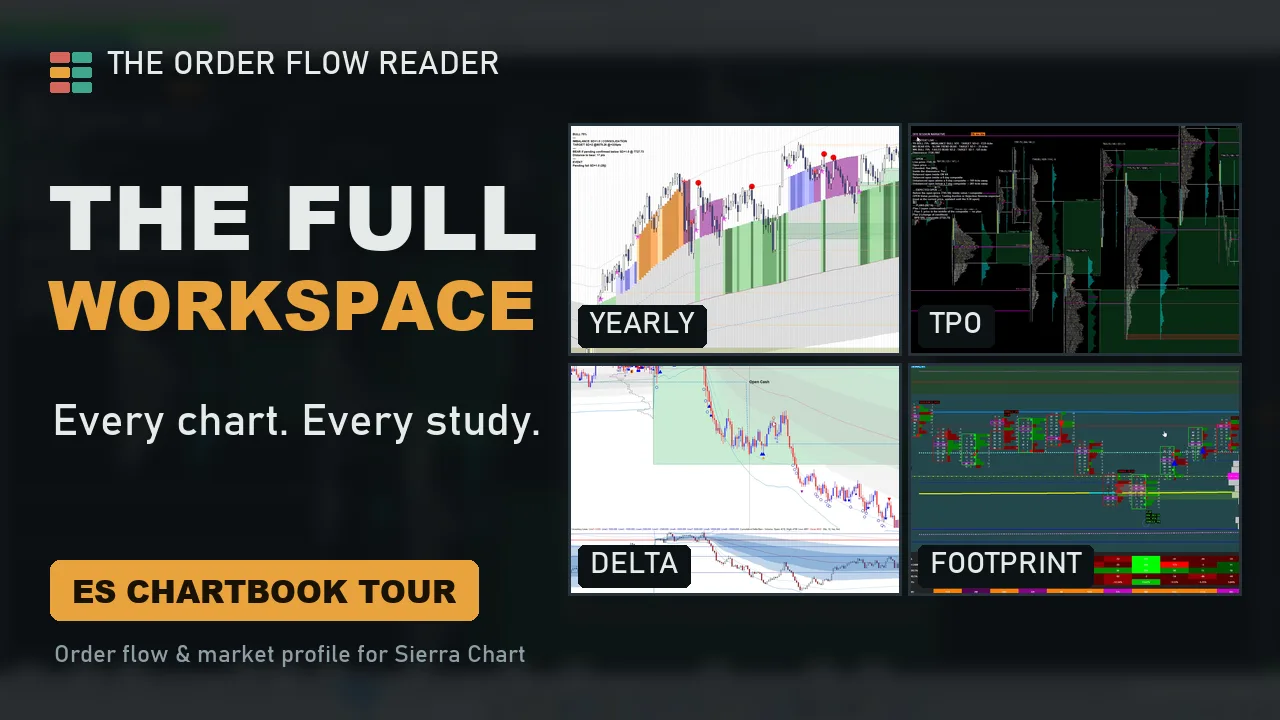
Thumbnail: The full workspace, every chart, every study. Yearly, TPO, delta and footprint charts of the ES Workspace 6:28
Start here · 6 min

Tour of the ES Workspace and every study

  1. 0:18 Yearly and monthly regimes
  2. 1:58 TPO: composites, key levels, narrative
  3. 3:15 Daily VWAP and cumulative delta
  4. 4:59 Footprint patterns and absorption
  5. 6:04 Chartbook or studies
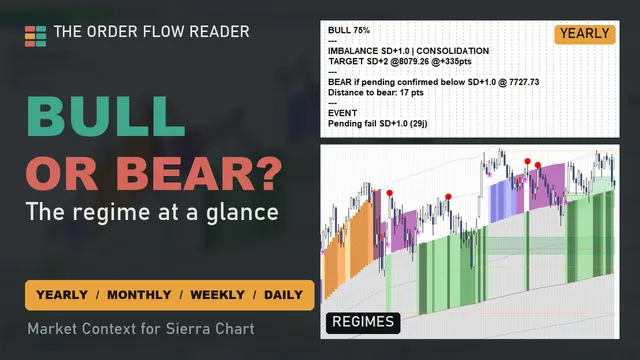
Thumbnail: Bull or bear? Market Context panel and yearly regime colors3:03

Market Context

Yearly, monthly and weekly regimes at a glance.

Thumbnail: Composites and narrative on the cash TPO chart4:16

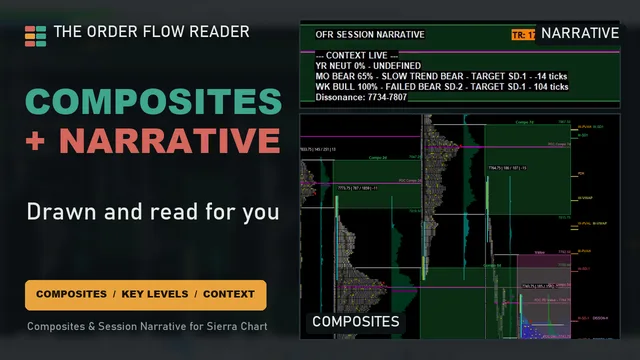
Composites & Key Levels + Session Narrative

Composites drawn for you, and the open read in one panel.

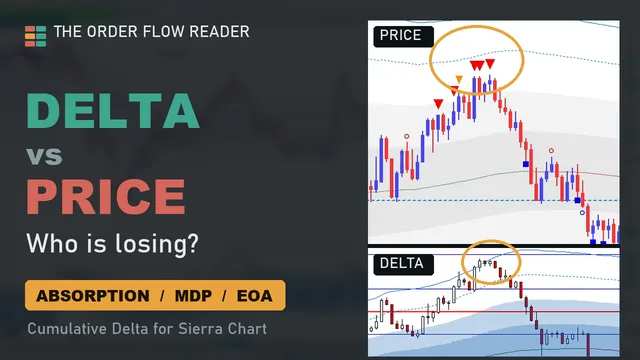
Thumbnail: Delta vs price, who is losing? Price and delta panels with absorption triangles4:22

Cumulative Delta

Absorption, pressure and missing participation.

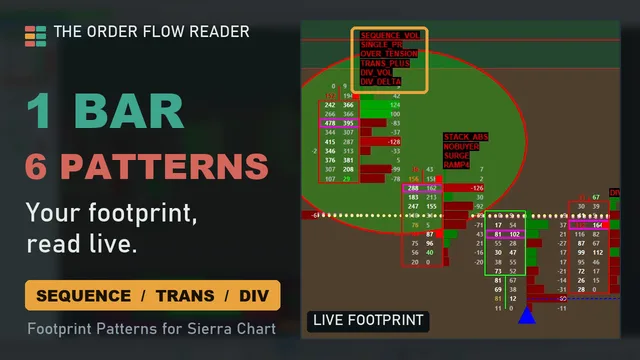
Thumbnail: One bar, six patterns, on a live footprint5:38

Footprint Patterns

One bar, six patterns: the footprint read live.

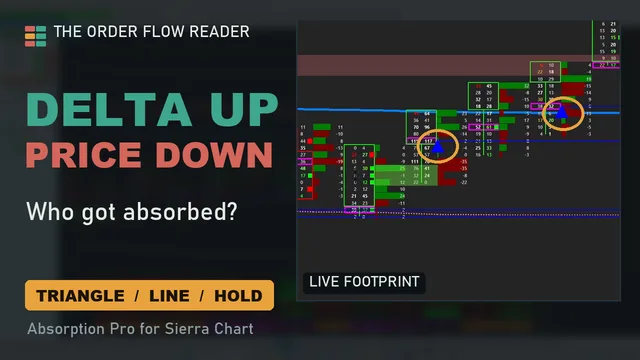
Thumbnail: Delta up, price down, absorption triangles on the footprint2:52

Absorption Pro

Who got absorbed, and which levels still hold.

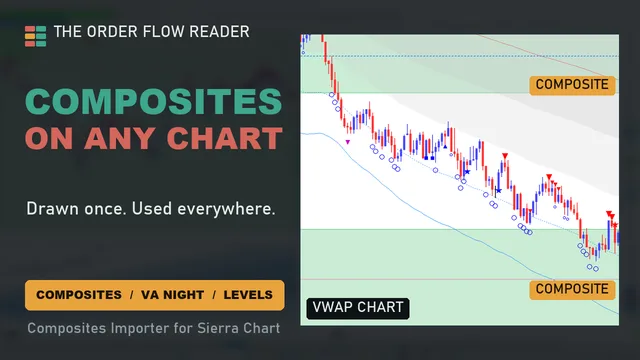
Thumbnail: Composites on any chart, composite zones on a VWAP chart1:20

Composites Importer

Your composites and night value on any chart.

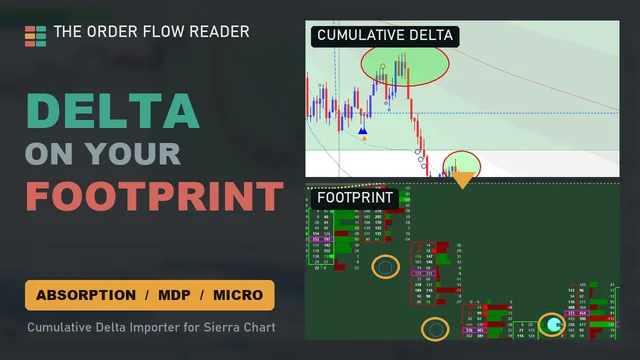
Thumbnail: Delta on your footprint, delta markers imported onto the footprint1:37

Cumulative Delta Importer

The delta markers, right on your footprint.

Thumbnail: Export all study inputs, free tool1:43

Study Inputs Exporter · free

Back up every study setting to one CSV.

Install and settings videos are on the way. Until then, setup help comes by email with your trial.

How it works

From sign-up to your first session in under an hour.

Start the trial

Pick a plan and enter your Sierra Chart username. Nothing is charged for 7 days.

Get authorized

Your username is added to the studies' license list, usually within a few hours.

Open or install

With the ES Workspace, import the chartbook and start reading in minutes. On your own charts, the install guide shows how to add the studies and link them.

Trade with it

Use it live or in replay. Cancel before day 7 and you pay nothing.

PlatformSierra Chart on Windows, Package 5 or higher (TPO and footprint features required).
DataTick-by-tick data with bid/ask volume, e.g. Denali Exchange Data Feed or Rithmic.
MarketBuilt and tested on ES (S&P 500 E-mini). MES uses the same charts.
Pricing

All six studies, every update, one price.

Subscriptions start with a 7-day free trial. Cancel any time from your account.

Founding member pricing The first 30 subscribers keep the launch price for as long as their subscription stays active. Regular price afterwards: $79 / month or $699 / year.
Monthly
$79
$59/ month

The full suite, billed monthly.

  • All 6 studies
  • All updates and new studies
  • Practical videos for every tool
  • Email support
Start 7-day trial
One-time
$99once

The chartbook alone, studies not included.

  • Ready-to-open ES workspace
  • Built-in Sierra studies only
  • Lifetime use
Buy the chartbook

Prices in USD. VAT or sales tax is added at checkout where it applies.

Who builds it

Built from actual trading problems.

I built these studies because I needed them on my own Sierra Chart. Every feature starts with a problem I ran into while reading or executing the ES open.

The suite is maintained by one person who uses it every day. When something breaks on a roll day or in replay, I see it too.

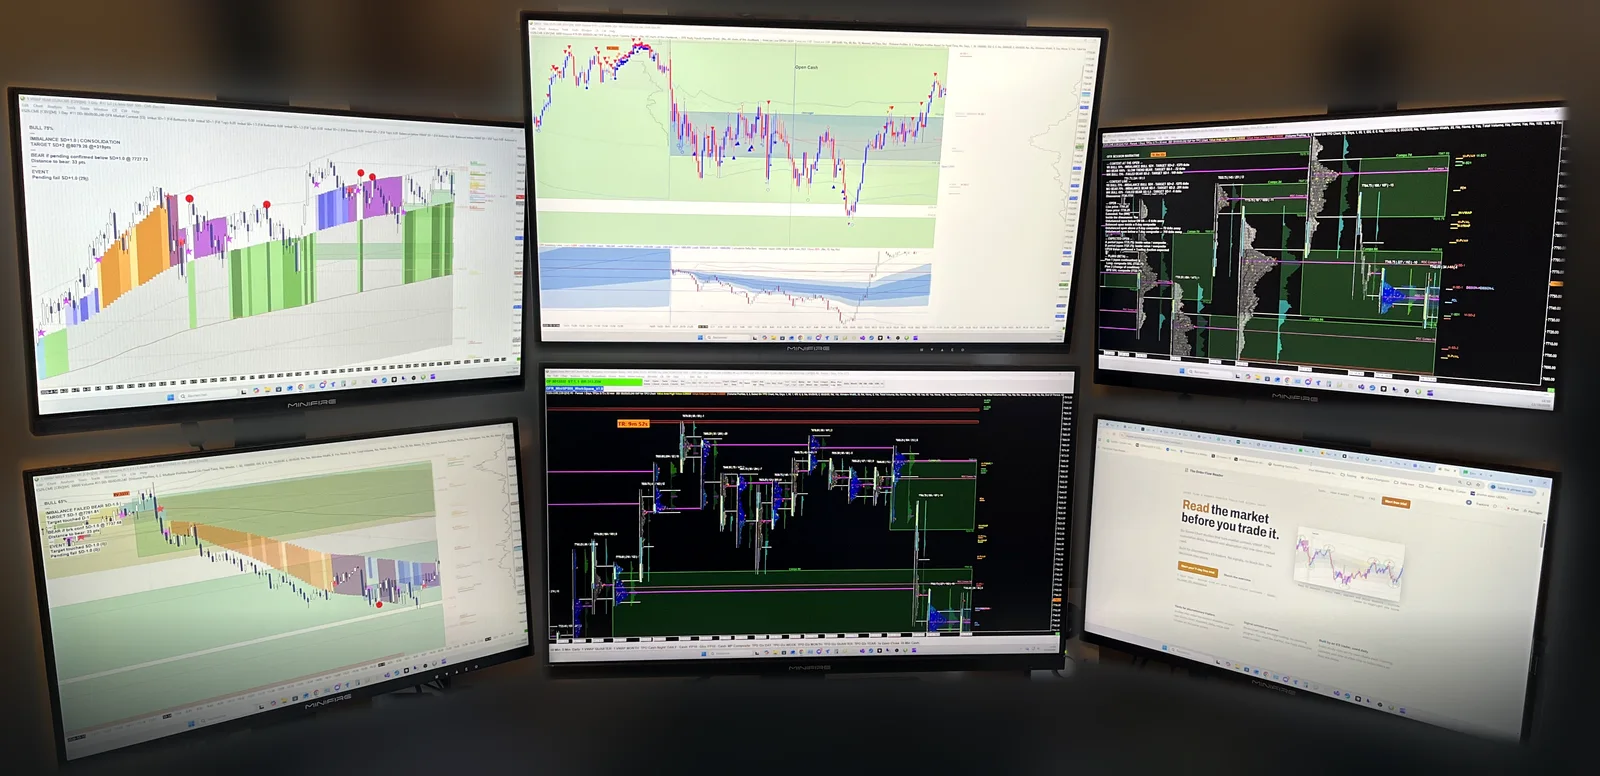
The trading desk: six screens running Sierra Chart with the suite, yearly and weekly Market Context on the left, the daily VWAP with cumulative delta and the TPO composites in the middle, the TPO narrative on the right
My desk, this week: six screens, the whole suite running on ES.
What traders say
“The studies have been a game changer for me, because they let me read the markets much faster.”
Ursulatranslated from French
“I mainly use the CDV [Cumulative Delta] study every day on ES. The absorption and missing participation signals let me spot at a glance the areas where the market is running out of steam, without having to pick apart every footprint. My reading is faster and above all calmer: I spend less time hesitating and more time executing.”
Mathis DCumulative Delta · ES · translated from French
“The studies help me every day, first to prepare my trading, then to see the weaknesses of market participants with absorption and missing participation. Before, I had to watch the CDV levels and compare them with the previous ones; in real time it is very hard to follow everything. Now I read the market faster and focus on my entries. With Composites, all my drawings are clean and automatic, and I save a huge amount of time every day. With these studies I am more efficient and more available for trading.”
Aurel05Cumulative Delta · Composites · translated from French
FAQ

Questions traders ask first.

Is this a signal service?

No. The studies mark absorption, delta events and levels on your chart. They don't tell you to buy or sell, and there is no trade room or copy trading.

Do you teach a trading method?

No trading course and no coaching. Every tool comes with practical videos showing what it detects and how to read it on real ES sessions: what an absorption looks like, what a delta divergence means, how to read a composite.

Which Sierra Chart package do I need?

Package 5 or higher, because the suite uses TPO and footprint features. You also need a data feed with tick-by-tick bid and ask volume.

How does the trial work?

You give your Sierra Chart username at sign-up and it is authorized for 7 days. If you cancel before the end of the trial you are not charged and the studies stop working on day 7.

Why a subscription and not a lifetime license?

The studies keep evolving: fixes for new Sierra Chart versions, improvements from daily use and new tools added to the suite. An active subscription includes all of it.

Does it work in replay?

Yes. Composites and the session narrative are rebuilt correctly in replay, so you can study past sessions with the same reading as live.

Which markets are supported?

The suite is built and tested on ES and MES. Other index futures are on the roadmap.

Can I use it on several computers?

Yes. The license follows your Sierra Chart username, not the machine.

How do I cancel?

From the link in your purchase email, at any time. Access runs until the end of the period you paid for.
Try it on the next ES open.

Start your 7-day free trial